Digital Trends and Insights · Artificial Intelligence
Fact or Fake? Learn More About the Claude Usage Map
Recently, a detailed map showing Claude usage by country went viral on social media. The image highlights Israel as the undisputed leader in usage, with a score of 4.90x, sparking debate about its authenticity and what the numbers really mean.


Have you seen this Claude usage map?
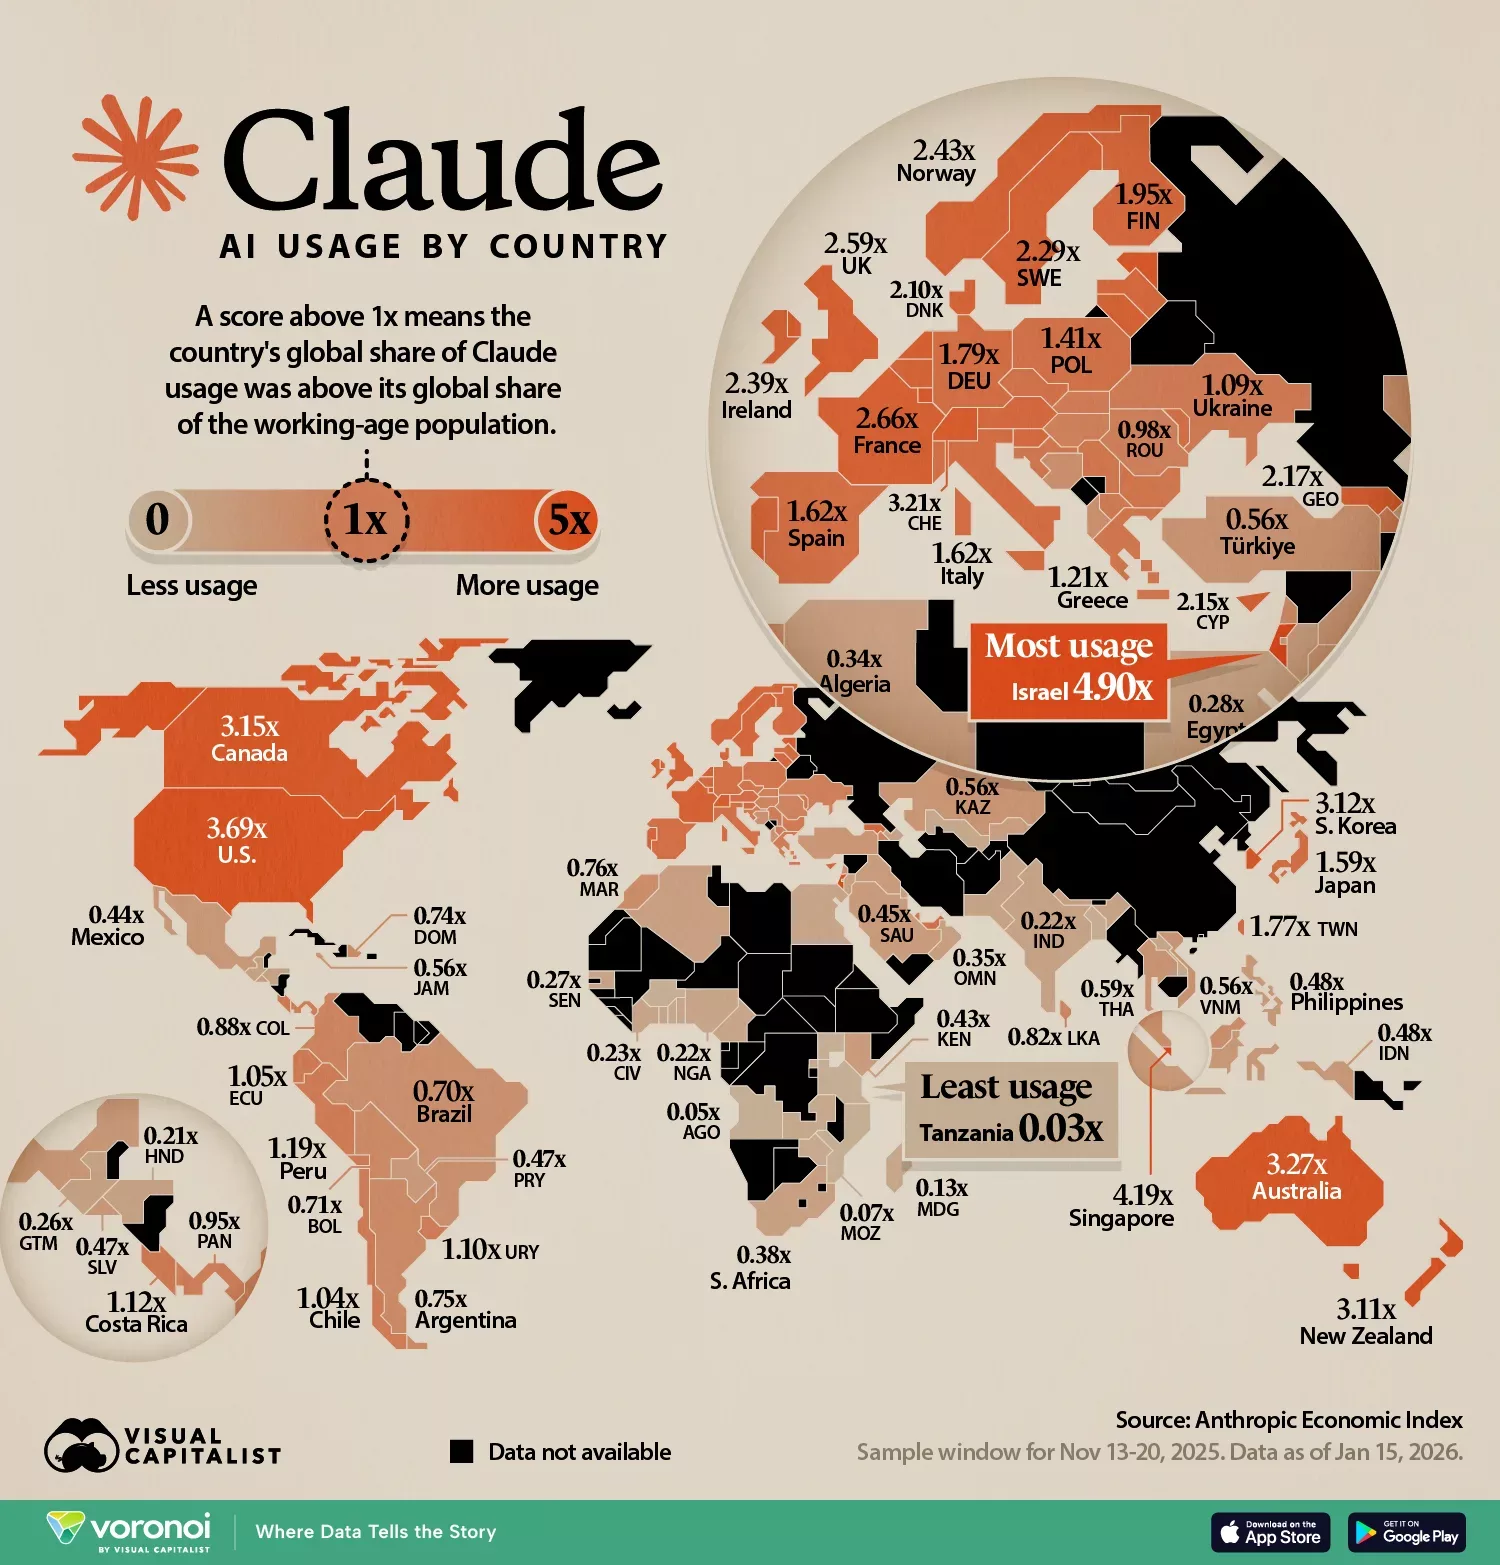
Our team conducted an in-depth investigation to verify the accuracy of this information, trace the original sources, and understand the context behind the data.
The Verdict: It's Fact
The short answer is: yes, the map is real and the data is accurate.
The image that went viral was originally published by Visual Capitalist , a highly respected platform known for turning complex data into accessible visualizations. Visual Capitalist has a strong track record of credibility, receiving a "Least Biased" rating and a high score for factual reporting from independent fact-checking organizations.
The data behind the map was not invented or estimated by third parties. It comes directly from the primary source: Anthropic, the company that created Claude.
The Original Source: The Anthropic AI Usage Index
The map is based on the Anthropic AI Usage Index (AUI) , a detailed economic report published by the company. The specific data shown on the map was collected during the week of November 13 to 20, 2025, and covers 116 countries.
The methodology behind the index is crucial to understanding the numbers. The AUI does not simply measure the total number of users in a country. Instead, it calculates usage relative to the working-age population of each nation.
"A score above 1x means that the country's global share of Claude usage was higher than its global share of the working-age population." (Visual Capitalist)
This explains why countries with smaller populations but highly developed technology sectors rank at the top, ahead of much more populous nations.
The Global Top 10: Israel Leads the Way
The data confirms the detail that drew the most attention in the viral map: Israel is, in fact, the clear global leader in Claude adoption.
|
Position
|
Country
|
Index (AUI)
|
|
1
|
🇮🇱 Israel
|
4.90x
|
|
2
|
🇸🇬 Singapore
|
4.19x
|
|
3
|
🇺🇸 United States
|
3.69x
|
|
4
|
🇦🇺 Australia
|
3.27x
|
|
5
|
🇨🇭 Switzerland
|
3.21x
|
|
6
|
🇨🇦 Canada
|
3.15x
|
|
7
|
🇰🇷 South Korea
|
3.12x
|
|
8
|
🇳🇿 New Zealand
|
3.11x
|
|
9
|
🇱🇺 Luxembourg
|
3.07x
|
|
10
|
🇪🇪 Estonia
|
3.05x
|
Source: Visual Capitalist / Anthropic AI Usage Index (November 2025)
Why is Israel leading by such a wide margin?
Israel's score of 4.90x means Claude usage in the country is nearly five times higher than expected based on the size of its workforce. This comes as no surprise to technology industry experts.
Known globally as the "Startup Nation," Israel has one of the world's densest innovation ecosystems. Recent reports confirm its leading position: a November 2025 study found that artificial intelligence is nearly universal in Israel's high-tech sector, with 95% of employees regularly using AI tools.
In addition, Israel leads the world in the number of researchers per capita and has a robust National AI Program focused on ensuring the country's long-term leadership in this sector .
Where Does Brazil Fit In?
For Brazilian users who have seen the map, the country's position may seem surprising at first. Brazil has an index of 0.70x, ranking 66th globally.
Does this mean Brazil makes little use of Claude? Not exactly. In absolute terms (total conversation volume), Brazil is among the world's biggest users. However, because the index adjusts the data for the size of the working-age population, the score falls below 1.0x. This shows that although usage is high, the tool's penetration among the overall workforce is still proportionally lower than in developed countries .
The AI Adoption Pattern
Anthropic's reports reveal fascinating insights into how AI is being adopted globally:
- Correlation with Income: AI use is strongly correlated with GDP per capita. Wealthier countries tend to have significantly higher adoption rates.
- Differences in Usage: In countries with lower adoption (such as Brazil), Claude is used predominantly for programming and education tasks. In leading countries, usage is much more varied, spanning business, science, and complex professional applications.
- Automation vs. Augmentation: Regions with high adoption tend to use AI more for "augmentation" (human-AI learning and iteration), while areas with lower adoption focus more on "automation" (delegating entire tasks to machines) .
The map perfectly illustrates the current global divide in AI adoption: while technology-focused nations such as Israel and Singapore are deeply integrating AI into their workforces, much of the world is still in the early stages of this technological revolution.